ShopDreamUp AI ArtDreamUp
Deviation Actions


Suggested Deviants


Suggested Collections


![Animus 2.01 Rainmeter [beta]](https://images-wixmp-ed30a86b8c4ca887773594c2.wixmp.com/i/13503321-b83f-4470-b065-3aa4ef39bc07/d567cpv-4e1e100c-c4bf-4162-986b-4531be958c99.png/v1/crop/w_184,h_184,x_13,y_0,scl_0.20932878270762,q_70,strp/animus_2_01_rainmeter__beta__by_feryandi_d567cpv-92s-2x.jpg)
![Animus 2.01 Rainmeter [beta]](https://images-wixmp-ed30a86b8c4ca887773594c2.wixmp.com/i/13503321-b83f-4470-b065-3aa4ef39bc07/d567cpv-4e1e100c-c4bf-4162-986b-4531be958c99.png/v1/crop/w_92,h_92,x_6,y_0,scl_0.10466439135381,q_70,strp/animus_2_01_rainmeter__beta__by_feryandi_d567cpv-92s.jpg)
![Work Launcher [1.3]](https://images-wixmp-ed30a86b8c4ca887773594c2.wixmp.com/i/aa71009e-5bfc-4bb3-9972-43df926509f8/d6y68ou-9d74f3a6-3f58-4b8c-a5a5-b3a332ecf404.jpg/v1/crop/w_184,h_184,x_0,y_43,scl_0.14603174603175,q_70,strp/work_launcher__1_3__by_activecolors_d6y68ou-92s-2x.jpg)
![Work Launcher [1.3]](https://images-wixmp-ed30a86b8c4ca887773594c2.wixmp.com/i/aa71009e-5bfc-4bb3-9972-43df926509f8/d6y68ou-9d74f3a6-3f58-4b8c-a5a5-b3a332ecf404.jpg/v1/crop/w_92,h_92,x_0,y_22,scl_0.073015873015873,q_70,strp/work_launcher__1_3__by_activecolors_d6y68ou-92s.jpg)


![[openbox] meh,](https://images-wixmp-ed30a86b8c4ca887773594c2.wixmp.com/i/7ebcf763-6520-4527-b2f5-4287e80050b2/d9c5ifq-47aa05ff-59cd-4609-aed0-ea5e186f2a8e.png/v1/crop/w_184,h_184,x_36,y_0,scl_0.23958333333333,q_70,strp/_openbox__meh__by_lovelybacon_d9c5ifq-92s-2x.jpg)
![[openbox] meh,](https://images-wixmp-ed30a86b8c4ca887773594c2.wixmp.com/i/7ebcf763-6520-4527-b2f5-4287e80050b2/d9c5ifq-47aa05ff-59cd-4609-aed0-ea5e186f2a8e.png/v1/crop/w_92,h_92,x_18,y_0,scl_0.11979166666667,q_70,strp/_openbox__meh__by_lovelybacon_d9c5ifq-92s.jpg)


Description
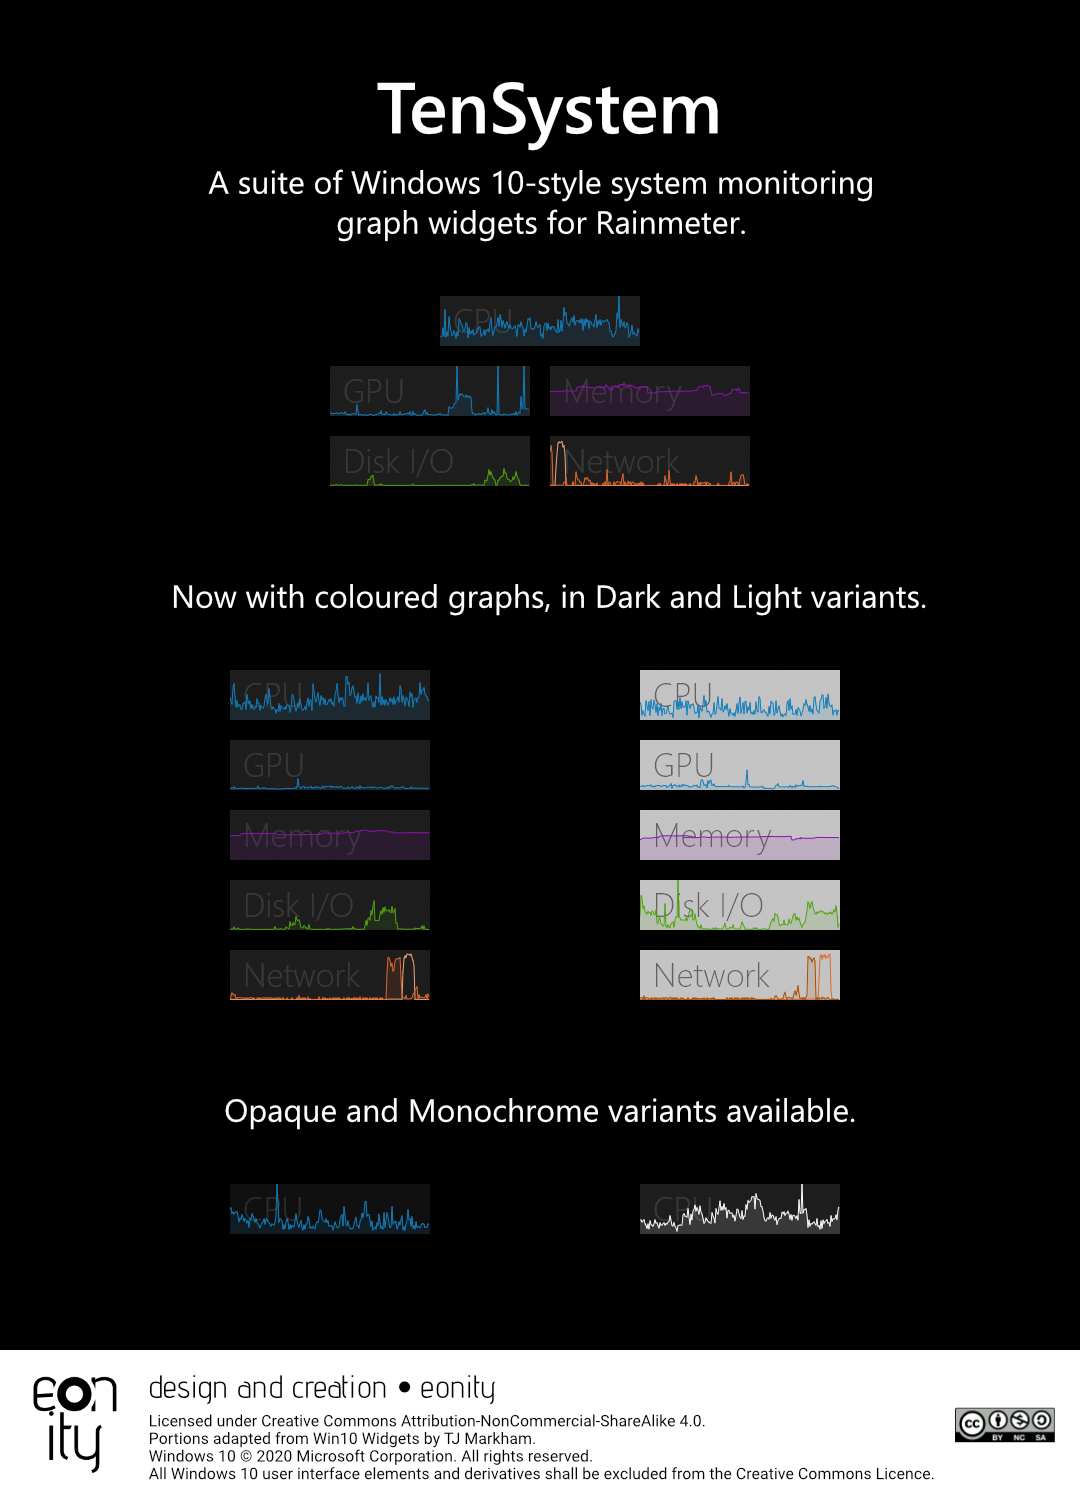
TenSystem for Rainmeter
Version 4.1.3
-----
Version 4.1.3
-----
A suite of Windows 10-style system monitoring
graph widgets for Rainmeter. To use, simply run the .rmskin package to install, then use the Manage Rainmeter window to load your preferred variant of each widget (5 widgets each with 8 different variants).
Unlike many other Rainmeter system monitoring widgets/skins/suites, TenSystem is designed to be lightweight and immediately usable out-of-the-box, without requiring the installation of, or running in the background, any additional third-party apps. This is achieved by relying as much as possible on Rainmeter's built-in functionality or its included UsageMonitor plugin, which pulls system information from the Performance Monitor (PerfMon) utility that is included in Windows 10.
Each widget monitors the usage or activity of an aspect of your device, and displays them as a graph. Additional system information is shown in a tooltip when you hover over them with your mouse cursor.
- The CPU widget monitors your device's CPU processor activity. Hover over with the mouse cursor to see usage percentage as a number, or to view the current speed (frequency) your processor is running at, as well as its base clock speed.
- The GPU widget monitors your device's GPU processor activity. Hover over with the mouse cursor to see the over GPU processor usage percentage as a number, or to view the amount of dedicated and shared GPU memory currently in use.
- The Memory widget displays the amount of memory (RAM) that your device is currently using. Hover over the widget with the mouse cursor to see memory usage in GB, as well as the amount of free and total memory.
- The Disk I/O widget monitors the amount of disk activity on your device. Hover over with the mouse cursor to see activity percentage as a number, or to view the current read and write speeds of your disk(s).
- By default, the Disk I/O widget is configured to display overall disk activity from all physical disks attached to your device. To configure it to show disk activity from a single disk drive, hover over the widget and click the Settings icon on its top-right corner, then select A Single Disk in the configuration widget that appears.
- Selecting A Single Disk will configure the widget to monitor your system drive (usually C: ) by default; you can change this by entering the letter of the disk drive you wish to monitor in the text box below.
- The Disk I/O widget can monitor disk activity from physical disk drives or partitions that have been assigned a drive letter. This includes internal hard disks or SSDs, as well as external hard disks, SSDs, or thumb drives, but excludes non-physical disks such as CD/DVD drives, network drives, or RAM disks (an error message will be shown if attempting to monitor such a drive).
- If an external disk drive that is being monitored by the Disk I/O widget is removed from your device, the widget will display an error; in this situation, open Settings to select another disk drive to monitor.
- Disk I/O widget does not support the monitoring of disk activity of disk drives without an assigned drive letter. Use the Disk Management utility in Windows to assign a drive letter to these drives first.
- The Network widget shows the amount of network activity - both sending (outbound) and receiving (inbound). Hover over the widget with the mouse cursor to view detailed network throughput stats in bits per second (bps), including total throughput in both directions.
- Receiving (inbound) traffic is represented on the graph by the line with a shaded area beneath it, while sending (outbound) traffic is represented by the line with no shaded area beneath it. The included variants colour each line with a slightly different shade as well.
- If your device has multiple network adapters installed, the Network widget will automatically detect and monitor the currently-active network adapter in use. If more than one network adapter is in use, the Network widget will prefer a wired network connection over a wireless one.
- By default, the vertical scale of the widget's graph is set to 1000 megabits (Mb), or 1 gigabit (Gb), as the maximum. If the maximum bandwidth of your network connection is lower or higher than this (or if the scale is not appropriate for your network's typical activity), you can change this in settings by hovering over the Network widget and clicking the Settings icon on its top-right corner.
Minimum system requirements:
- Windows 10 (version 1709/Fall Creators Update or later required for the GPU widget)
- Rainmeter 4.4 Beta (r3433)
Notes:
- The FrostedGlass plugin is required by the non-Opaque variants for the Fluent Design Acrylic Blur to show properly. If you did not install the plugin when prompted, you may download the plugin from here, and manually installing it by extracting the appropriate DLL files to the Rainmeter plugin folder (usually C:\Users\[YourUserName]\AppData\Roaming\Rainmeter\Plugins).
- While it may be possible to use TenSystem with an older, incompatible version of Windows by manually extracting files from the .rmskin package, the widgets may experience interface errors and not display correct information or work at all due to missing features in earlier versions of Windows. In particular, the GPU widget requires Windows 10 version 1709 (Fall Creators Update) or later to work properly.
-----
Changes to version 4.1.3
- The drag-and-drop lag issue with the non-opaque variants have been fixed.
-----
Changes in older versions
Changes to version 4.1.2
- The CPU widget has been changed to read processor base/max frequency from Performance Monitor instead of the Windows Registry. In addition, the CPU widget will now be able to monitor overall CPU usage stats from both physical CPUs if used on such a device or system. Note that this usage scenario has not been tested and may not work properly in this situation.
Changes to version 4.1.1
- Minor UI tweaks and fixes.
Changes to version 4.1
- You can now open Task Manager from within any of the TenSystem widgets. Hover over any of the widgets and click on the Open Task Manager icon on the top-right corner to open Task Manager.
- The Settings button's icon in the Disk I/O and Network widgets have been enlarged for better legibility.
- Minor tweaks for the Disk I/O widget's error message UI, and the GPU widget's tooltip.
- The CPU widget now explicitly displays usage stats, including processor usage percentage, from only the first physical CPU, if used on a Windows 10 Pro device or system with two physical CPUs installed.
- Variant changes:
- The SettingsGlyphColor variable in the Disk I/O and Network widgets has been replaced with the ToolbarButtonGlyphColor variable.
- All widgets now require the ToolbarButtonHoverColor and ToolbarButtonGlyphColor variables for setting the colours of the button for Open Task Manager (as well as the button to open the Settings widget for the Disk I/O and Network widgets).
- Coding changes: all Segoe MDL2 Assets characters are now referenced to with their hexadecimal code through the use of character variables.
Changes to version 4.0
- You can now configure the Disk I/O widget to monitor overall disk activity from all physical disks, or from a single disk drive that you select.
- The Disk I/O widget now uses the LogicalDisk object from Performance Monitor instead of the PhysicalDisk object.
- Fixed a bug in the Disk I/O widget: the widget should now no longer display active times exceeding 100%.
- All-new variant skins: TenSystem now features 8 new variant skins for each widget.
- The Dark and Light variants respectively feature either a dark look, or an all-new light look, with new coloured graphs matched to their respective colour in Windows Task Manager.
- Opaque and non-Opaque variants, with non-Opaque variants featuring Fluent Design Acrylic Blur.
- Monochrome or non-Monochrome variants; non-Monochrome variants feature coloured graphs, with each widget's graph colour being the same as what Windows' Task Manager uses for their respective graphs.
- The previously-included variant skins have been removed starting with this version.
- All TenSystem widgets are now completely dynamically rendered in code instead of relying on static raster images.
- The colour of each widget's background is now dynamically set by a variable within the variant skins themselves, allowing variant skins to define their own coloured background for each widget without relying on external raster images.
- Variant skins now all utilise the same variables-based system for defining the colours of each widget's UI elements that was first introduced with TenPlayer 3.0. This does break backward-compatibility with variants written for older versions of TenSystem, but it should be easy to update them for compatibility with version 4.0. Check the code of the included variant skins for details on how to use the new variables-based system.
- The background label should now be more legible under different conditions with the non-Opaque variants.
- Minor code-efficiency and UI tweaks.
Changes to version 3.0
- Redesigned widgets: the design of all TenSystem widgets have been simplified. The icon has been removed, and the graph now takes up the entire area of the widget. The widgets also now displays tooltips showing more detailed usage stats when you hover over any part of the widget.
- New additions to the TenSystem widget suite: GPU, Network, and Disk IO:
- The GPU widget shows the utilisation of your device's GPU; hover over the widget for a tooltip showing the exact usage percentage, as well as the amount of both dedicated and shared VRAM currently in use. This widget makes use of Rainmeter's UsageMonitor plugin, which reads system information from Windows' Performance Monitor.
- The Network widget shows the amount of network traffic on your device's network connection, with visual separation for both inbound (receiving) and outbound (sending) traffic. Hover over the widget to see how much traffic your device is sending or receiving in bits per second, or to open its Settings widget to configure the maximum vertical scale of the widget's graph (by default, the Network widget's graph's maximum scale is set at 1000 megabits, or 1 gigabit).
- The Disk IO widget shows the averaged amount of activity on all of your device's physical disks (i.e. all internal hard disks on your device, as well as any external hard disks or USB drives attached to it). Hover over the widget to see the exact percentage of disk active time (averaged over all physical disks), or the total read and write speed of all the physical disks attached to your device. This widget makes use of Rainmeter's UsageMonitor plugin, which reads system information from Windows' Performance Monitor.
- The CPU widget has been rewritten to use Rainmeter's UsageMonitor plugin. With this change, the CPU widget is now able to display the current CPU's running speed, or frequency, when you hover over it. The base speed of your CPU is now also displayed when you hover over the widget.
- The Memory widget now displays more detailed usage stats when you hover over it: it now displays the amount, in gigabytes, of memory in use, available, and the total amount of memory installed on your device.
- More easily "themeable": in addition to the background image of the widget, the colours of the background label and graphs are now defined in the variant skins themselves instead of within the back-end source code, allowing for the creation of more varied TenSystem variants. This does break compatibility for variants written for older versions of TenSystem, but they can be easily updated for version 3.0 with the addition of new lines of code; check the included updated variant skins for the code you need to add to your existing variants.
Changes to version 2.0:
- After years of neglect, TenSystem is now finally updated to be more on-par with TenPlayer. Just like TenPlayer, glyphs in TenSystem are now dynamically rendered using the Segoe MDL2 Assets font, making their display cleaner, more consistent, and more resolution-independent.
- TenSystem now features the same background variants as TenPlayer (default, Transparent, and Opaque), with the default variant featuring real Fluent Design Acrylic Blur using the FrostedGlass plugin just like TenPlayer.
- Coding and back-end tweaks: as with what happened with TenPlayer in versions 2.0 and 2.1 respectively, the source code of TenSystem is now documented from within the source code, which is now more consistently-formatted, and the skins have also been split into separate front-end and back-end files. This allows future updates to core TenSystem functionality to be more easily made (as all changes need to be made only in one place), as well as making variant skins more easy to create and/or modify.
Credits and copyright notices:
- The declaration here by deviantART that TenSystem is licensed under the Creative Commons Attribution-Noncommercial-Share Alike 3.0 licence is inaccurate but cannot be changed due to limitations on deviantART. TenSystem is licensed under the Creative Commons Attribution-Noncommercial-Share Alike 4.0 Licence, as accurately declared within TenSystem's metadata. This latter declaration shall override any and all copyright and Creative Commons licence declarations on deviantART.
- Portions adapted from Win10 Widgets by tjmarkham.
- FrostedGlass plugin by theAzack9.
- Windows 10 © 2020 Microsoft Corporation. All rights reserved. All Windows 10 user interface elements and derivatives shall be excluded from the Creative Commons Licence.
Comments16
Join the community to add your comment. Already a deviant? Log In
Do you plan to add CPU/GPU temp graph?